

Environment
Uno Minda acknowledges the responsibility of businesses to help address the world’s global issue such as climate change. Climate change is one of the greatest challenges of our time and we as an organisation are cognizant of our role. We are establishing procedures in building reduction strategies to combat Green House Gas (GHG) emissions. Energy conservation and optimisation is of the utmost importance to us.
Capital Impacted
Natural Capital
SDGs Impacted
Performance Highlights of FY 2022-23
1,40,292 GJ
Of Renewable Energy Consumption
33 %
Of Total Waste is Recycled
0.16
Reduction In Energy Intensity
Uno Minda’s Approach For The Environment
Uno Minda Group is committed to set global standards in environment conservation, water stewardship, energy efficiency, waste management to fulfil its responsibility as a best corporate sector in auto components manufacturing. The Group is dedicated to a clean, green, hygienic environment and towards conserving and preserving natural resources. It works on prevention and mitigation approach by reducing pollution, maximising recycling, minimising waste, reducing discharge and emissions, and effectively using sewage and waste treatment plants. Our sustainability roadmap, which entitles a broader aspect of environmental responsibility, is not only integration of pre-environmental factors in decision making but also consistent improvement of eco-efficiency in all operations.
Protecting Environment
- Invest in technologies and processes that promote environmental sustainability such as energy-efficient manufacturing processes, renewable energy sources, and waste reduction strategies. By adopting these sustainable practices, the company aims to minimize its carbon footprint and resource consumption.
- Implement monitoring and reporting systems to track progress and assess the effectiveness of its environmental initiatives. The Company regularly measures key environmental metrics, such as energy consumption, greenhouse gas emissions, water usage, and waste generation, to evaluate its performance.
- Actively communicate environmental initiatives to stakeholders, both internally and externally. The company shares its environmental goals, progress, and achievements through various channels such as sustainability reports, company websites, and public statements.
- Fostering a culture of environmental awareness, every stakeholder is encouraged to contribute to its sustainability goals.
Material Issues Addressed

Energy Management and Energy Transition

GHG Emission Management

Water Management

Waste Management
Energy Management
Uno Minda’s approach
Energy management in India has risen considerably due to its increasing population, rapid industrialisation, growing demands on use of resources such as lighting, cooking, space cooling, mobility, industrial production, office Automation. However, strategies for an efficient use of resources which help in reducing carbon emissions that are lagging behind.
This, along with inefficient use of energy resources when not in use has culminated into a massive greenhouse gases emission growth. Uno Minda has adopted use of biodiesel as a renewable energy resource by reducing the use of non-renewable in consecutive financial years.
58,220 GJ
Increase In Energy Sourced From Renewable Sources
4,34,850 GJ
Reduction is Energy Sourced From Non-Renewable Sources
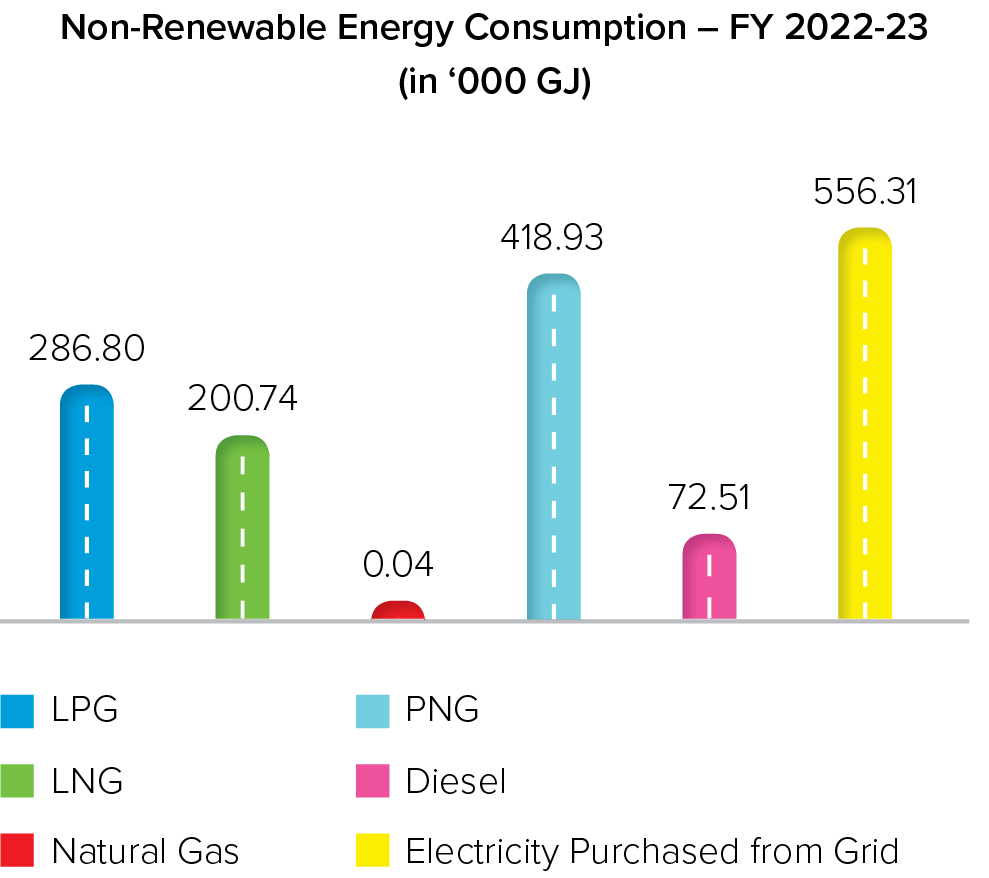
We strive to decrease energy emission by adopting efficient reduction strategies. Liquefied Petroleum gas (LPG), Liquefied Natural Gas (LNG), Natural Gas, Piped Natural Gas (PNG), Diesel and Electricity purchased from Grids comprises non-renewable energy sources.
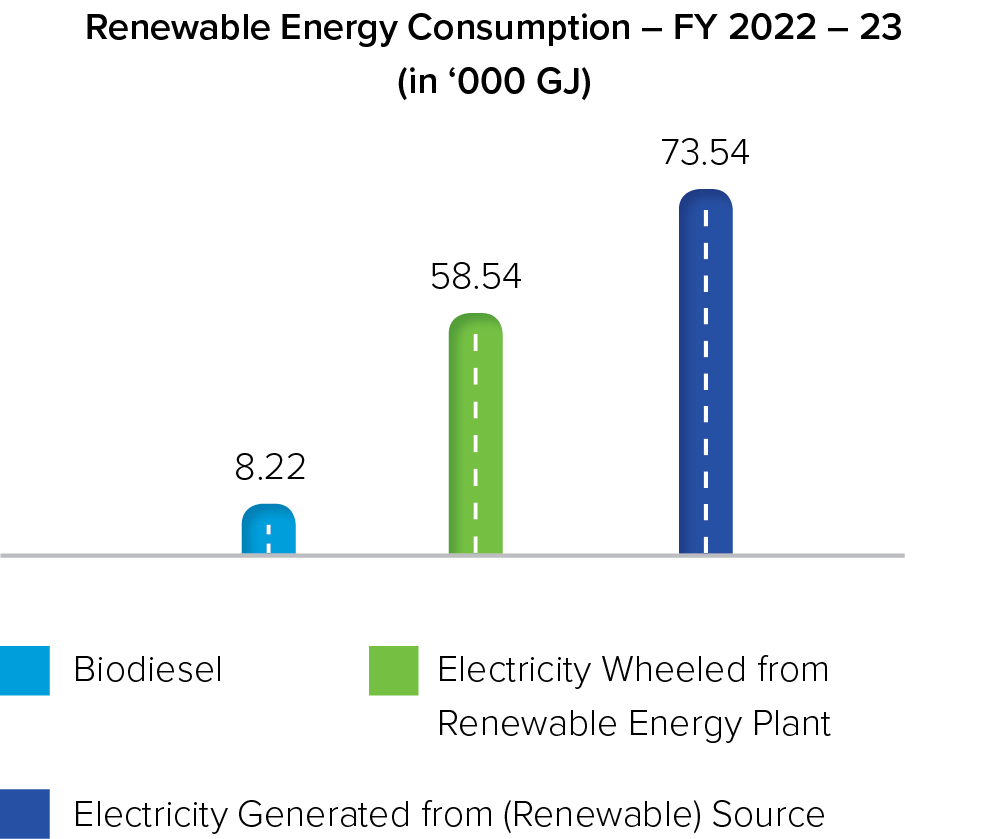
There has been a considerable decrease of 5% in energy consumption with respect to sale from non-renewable sources over the past two financial years. There has been 8% increase in use of renewable energy from FY21-22, as part of total electricity consumption for business and related activities. In current reporting year, we have reached to the milestone of using 18% of our electricity consumption share from renewable sources. We have developed robust methods to reduce non-renewable energy consumption in consecutive financial years by optimising our energy portfolio and adding multiple sources of clean energy. This is envisaged with a detailed plan for transition from non-renewable to renewable energy sources. We are moving towards achieving carbon neutral goals by improving energy management systems and establishing efficient technologies to mitigate emissions. Use of biodiesel, electricity wheeled from renewable energy plant are some key resources which are helping the Group in reducing emissions.
Energy Intensity:
Becoming energy efficient is our ultimate pathway to achieve reduced energy consumption. While our energy consumption has decreased due to more use of renewable energy sources, we continued energy efficiency initiatives and made gradual efforts to reduce our consumption.
Even while rising demand caused an increase in our energy usage in absolute terms, we are working on energy-efficiency projects and making modest effort to reduce our energy consumption.
Energy intensity for FY 2022-23: 0.25
(Total Energy Consumption in ‘000 GJ/turnover in ₹ Crores) Action areas for FY 2023-24
- Conducting energy audit for understanding potential energy saving areas for manufacturing plants
- We plan to implement activities which contribute towards increasing our renewable energy share through implementing solar roof top facilities for our manufacturing plants, adding wind and solar energy sources through open access
- Continuation of expansion in energy efficiency measures through process, technology and utility upgradation initiatives
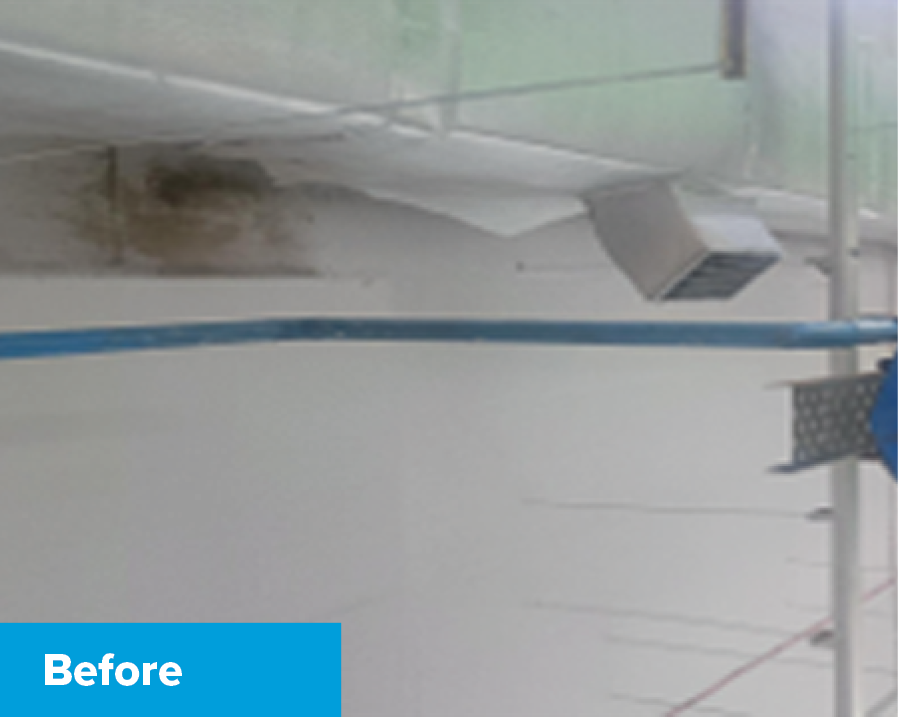
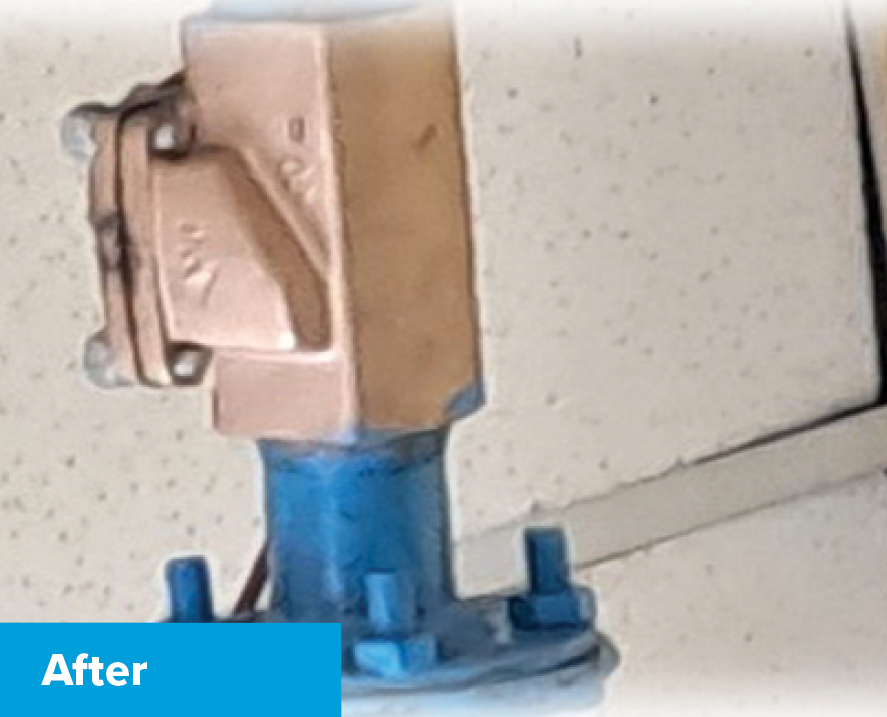
Case Study 1: Kaizen-1 Installation of Auto Shut-off Valve on all lines
Problem Definition/Issue faced/Idea: Installation of Auto shut-off valves on all lines to reduce idle time air leakage
Description of the Project: Pneumatic Auto shut-off valve to be installed on lines to control air leakage and load on main header
Key Learnings:Efficient air consumption in plant and preventing air leakage will allow us to control energy cost

Methodology
- Line idle consumption 10 KW/ day = 3100 units/year for each line
- For 13 lines idle air unit consumption is 40300 units/year
- This will also prevent idle time air leakage

Benefits
- The average unit per year of idle line to be reduced from 40,300 units/year to 0 units/year
- Power cost /year (before) =₹ 3.02 Lakhs
- Power cost/year (after) =₹ 0.0
- Power cost saving/year =₹ 3.02 lakh
- Carbon footprint reduction/year = 34.2 tons
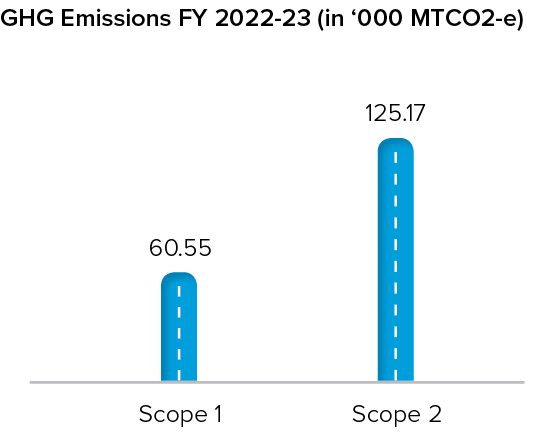
Emissions Management
Due to nature of the operations in our businesses, emissions make up a considerable portion of the Company’s environmental impacts. We recognise the implications of our energy consumption, both in terms of ecological effects and cost to our operations. We are taking dedicated efforts to minimise our carbon footprint and shift to renewable energy sources.
| GHG Emissions (in ‘000 MTCO2 eq) | FY 2022-23 |
|---|---|
| Scope 1 | 60.55 |
| Scope 2 | 125.17 |
Scope 1: Direct GHG Emissions
Scope 1 emissions are the direct greenhouse (GHG) emissions that occur from sources that are controlled or by an organisation. We have observed an incremental trend of fuel consumption which is coherent with our increased business activities and expanded footprint with increased production volumes.
Scope 2 emissions are indirect GHG emissions associated with the purchase of electricity, heating, or cooling. Although Scope 2 emissions physically occur at the facility where they are generated, they are accounted for in an organisation’s GHG inventory as they are a result of the organisation’s energy use. We have made a conscious effort to shift from electricity sourced from traditional grids to renewable grids, while increasing opportunities for renewable energy usage. The increase in Scope 2 emissions attributed to electricity consumption has seen an upward change due to increased business activities. As Covid-19 rules were relaxed, all of the plant sites were running at full capacity. An increased dependency on grid electricity is observed highlighting higher Scope 2 emissions.
Areas of Action for FY 2023-24
- We are taking firm steps towards shifting our energy sources from non-renewable energy mix to low carbon and renewable sources.
- Improving energy efficiency by usage of improved energy efficiency technologies such as usage LED lights, VRV systems, energy efficient chillers.
Emissions Management
GHG Emission intensity represents the facility including processes and overhead (Scope 1 and Scope 2 emissions)
GHG Emission Intensity for FY 2022-23: 0.03
(Total energy consumption in ‘000 MTCO2-e/turnover in ₹ Crores)
A considerable decrease in GHG emission intensity was observed due to improved energy efficiency, conservation and the use of lower-carbon energy sources.
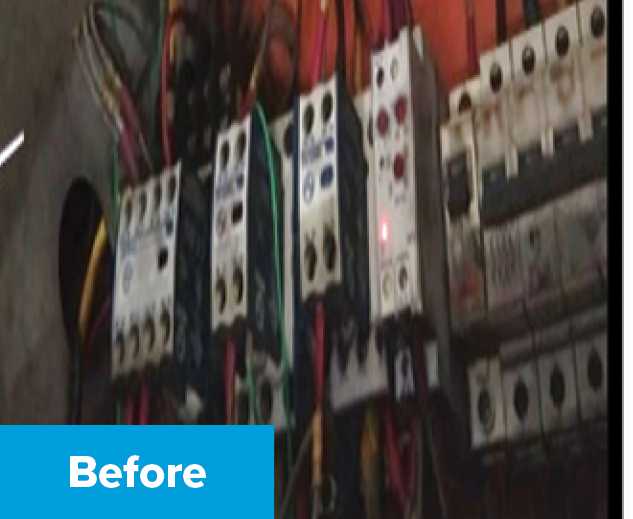
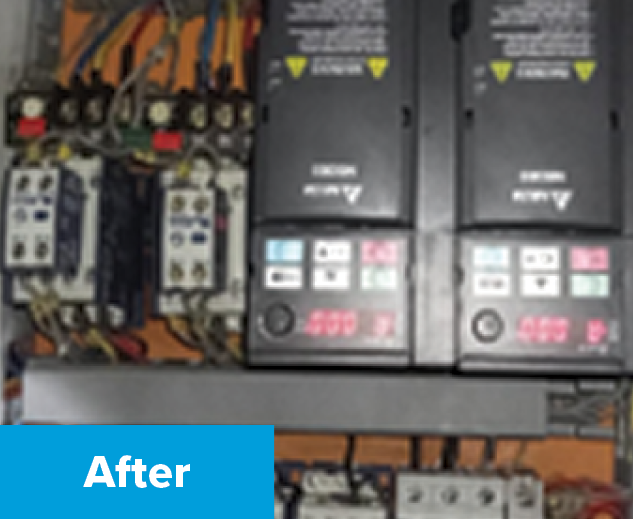
Case Study 2: Kaizen-1 Installation of VFD in ETP Air Blower
Problem Definition/Issue faced /Idea: Installation of VFD in ETP Air blower
Description of the Project: Installed VFD for ETP air blower to reduce energy consumption and we replaced earlier contactor logic to VFD
Key Learnings: Based on the low-speed motor RPM will vary so we can save energy
Methodology
- Earlier ETP blower used to run with contactor logic and this blower unit runs 24 hours, daily
- Now we have replaced contactor logic to VFD to save 30% electricity
- Earlier unit consumption was 35 units/day for one blower and for 70 units/day for two blowers
- Energy cost – 2.48 Lakhs/year
Benefits
- Unit consumption after VFD 27 units/day. And for two blowers
- Power cost /year (before) = ₹ 2.48 Lakhs
- Power Cost/year (after) = ₹ 0.94 Lakhs
- Power cost saving/year = ₹ 0.91 Lakhs
- Carbon footprint reduction/year = 5.4 Ton
Water Management
Our water management approach is distinguished by careful collection and innovative methods for successful water use. In order to maximise our available and sourced water, we implement several conservation initiatives in our plants, among them are replacing old pipelines, reusing water that has been treated for processes for minimising wastewater, utilising treated water for flushing, gardening and reusing it through treatment systems, setting up aerators for working usage for water. Waterless urinals have been established as pilot to reduce water usage in day to day operations.
We source water from various sources which depends on the Individual locations of sites. The major sources of water are ground water, municipal supplies and supplies from vendors (tankers). Our water withdrawal is in complete adherence to the regulatory permits on resources allocated from specific water sources.
We have taken an initiative to install number of rain water harvesting and recharge structures to replenish ground water sources.
Water Consumption
Guided by EHS Policy, we have embarked on a mission to moderate water consumption at all our plants and continuously attempt to improve our efficiencies. Several water conservation measures are implemented in our manufacturing sites to optimise our available and sourced water, amongst them are conducting water balance studies, internal water audits, installation of waterless urinals, regular water consumption monitoring through analog meters while guiding stakeholders on judicial water usage.
In FY 2022-23, total water consumption was reported at 7,31,804.24 KL. An increase in water consumption was observed due to increase in scale of production and rise in manpower. We have endeavored to take various steps to minimise pressure on water bodies throughout the supply chain and mitigate any negative impacts of our operations.
At Switch Division, Pune, approximately 12,000 litre/month of water is conserved through various water conservation measures for example water less urinals to be installed in toilets, BIN washing machine, cooling tower fins replacement and float valve stetting, float arrangement at powder coating spray tank. Similarly, Uno Minda took other conservation initiatives such as installing water sensor tap on all the hand washing and drinking water tap which saved around 35 KL per day. At another site 29 KL of ETP water was used for gardening purposes. Moving forward, we intend to implement a digital water management system that would enable us to monitor and optimise water consumption across various processes in our plants.
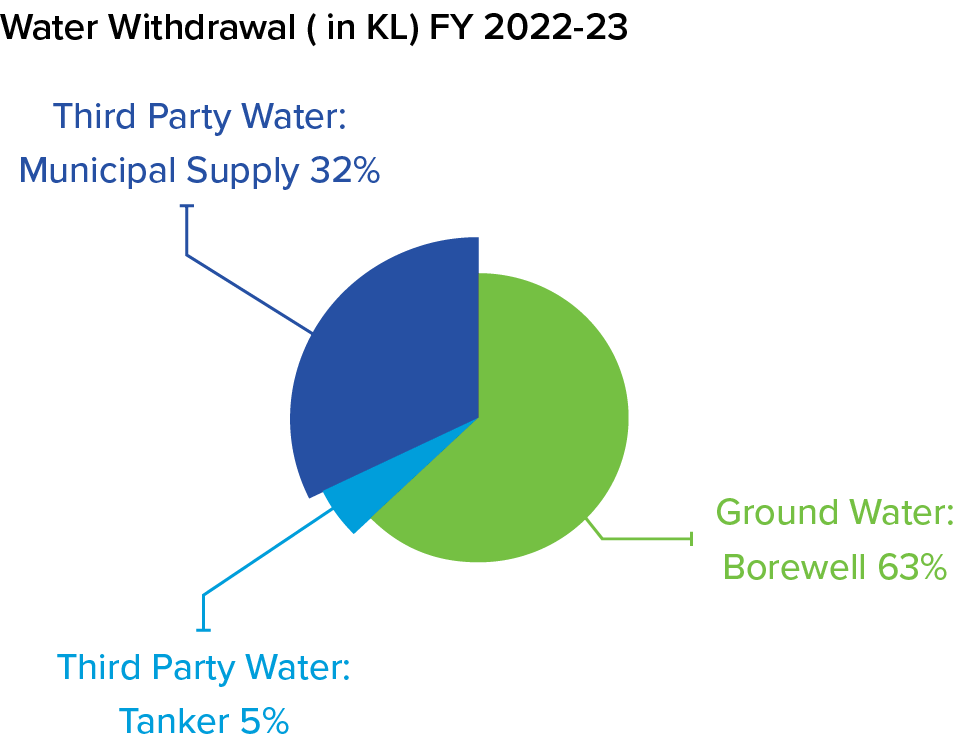
Water Withdrawal
The sources of water withdrawal is generally through borewells, purchasing water from vendors and through municipal water supply. The various sources of water withdrawal are presented below:
| Water Withdrawal (in KL) | FY 2022-23 |
|---|---|
| Ground Water: Borewell | 5,29,786 |
| Seawater/Desalinated Water | 2,196 |
| Third Party Water: Tanker | 43,313 |
| Third Party Water: Municipal Supply | 2,74,826 |
| Total | 8,50,121 |
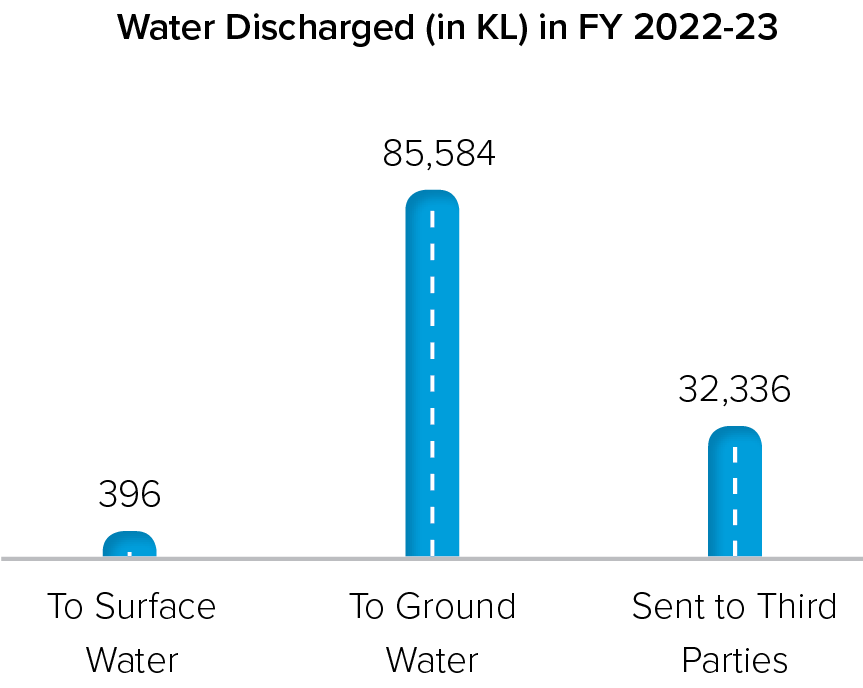
Water Discharged
Uno Minda ensures that there would be no negative impact caused to the environment while discharging the water. We endeavour to reduce our water footprint by recycling water, reusing the treated water and making sure the regional laws are being followed. Total water discharged for FY 2022-23 has increased due to increase water consumption at production sites.
Action Areas for FY 23-24
- We are making efforts to strengthen our water monitoring mechanisms, to ensure we track our water usage throughout the manufacturing cycle.
- Insights obtained from water monitoring exercise has prompted to use innovative ideas for water conservation in existing processes and add initiatives for water reuse.
Waste Management
Reducing and reutilising of waste is the prime vision of ours when managing waste comes into consideration. We adhere to the 3R approach principle: Reduce, Reuse and Recycle. To manage our waste materials, we implement various efficient waste management initiatives that consider environmental impact, social effects, and commercial viability. We dispose our hazardous waste through Government-approved vendors which ensure proper disposal of the wastes. Our non-hazardous waste is primarily recycled by sending it to competent recyclers.
Hazardous Waste
| Types of Waste | Unit | FY 2022-23 |
|---|---|---|
| Used Oil | Tons | 751 |
| Coolant Mixed Water | Tons | 40 |
| ETP Sludge | Tons | 152 |
| Paint Sludge/Lacquer Waste | Tons | 475 |
| Sludge from Wet Scrubber | Tons | 10 |
| Phosphate Sludge | Tons | 17 |
| Oily Socked Clothes | Tons | 18 |
| Used Filter | Tons | 3 |
| Empty Container (Oil, thinner, Paint, Grease) | Tons | 412 |
| Batteries/Electronic Waste | Tons | 487 |
| Others (Unit Specific) | Tons | 2,058 |
| Total Hazardous Waste | Tons | 4,429 |
Non-Hazardous Waste
| Types of Waste | Unit | FY 2022-23 |
|---|---|---|
| Metal Waste | Tons | 1782 |
| Plastic Waste | Tons | 1679 |
| STP Sludge | Tons | 185 |
| Others | Tons | 2562 |
| Total Non-hazardous Waste | Tons | 6210 |
| Types of Waste | Unit | FY 2022-23 |
|---|---|---|
| Total Hazardous Waste | Tons | 4,429 |
| Total Non-Hazardous Waste | Tons | 6,210 |
| Total Waste Generated | Tons | 10,693 |
At Uno Minda, circularity is one of the action fields in our execution programme. We are working continuously for improvement in reducing waste generation which has led to us achieving increased levels of recycling of the waste generated year on year. In FY 2022-23, out of 10,639.86 tons of total waste generated, 33% of the waste was recycled. We manage all the waste that we generate in compliance with local regulations and by processing it through authorised vendors and recyclers. The Company recycles materials wherever it is usable within the Company, and that which cannot be reused is disposed off in a manner in compliance with applicable statutory provisions.
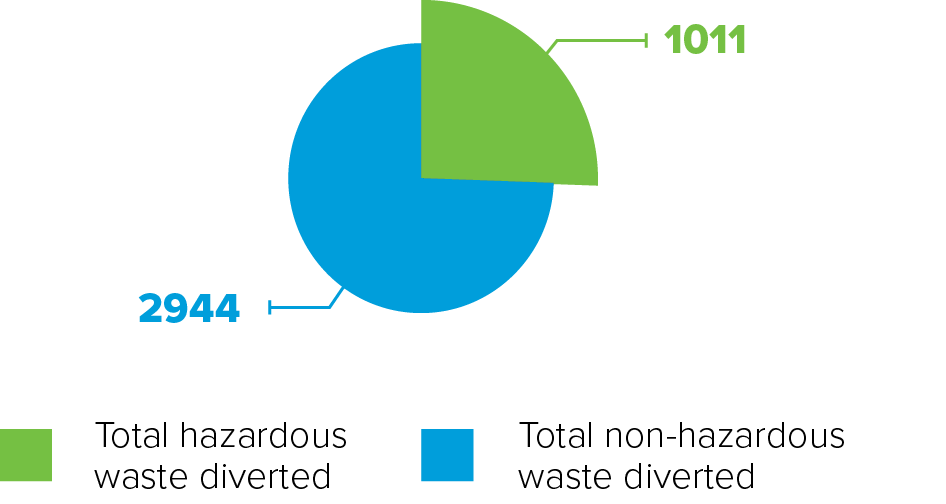
Total Waste Diverted in FY 2022-23 (in tonnes)
| Types of Waste (Tons) | FY 2022-23 |
|---|---|
| Total hazardous waste diverted | 1,011 |
| Total non-hazardous waste diverted | 2,944 |
| Total | 3,956 |
Action area for FY2023-24
- Uno Minda has structured plan for reusing possible materials throughout the production cycle. Plant specific strategies have been developed for the same
- To reduce the landfill waste, context specific strategies have been planned with external vendors having maximum efforts for recycling and end usage
Waste Disposal
Waste disposal consists of waste collection at source, its categorisation, processing for the types of waste which cant be recycled or reused. For thorough documentation purpose, waste is classified by Source and Composition categories. We have classified the waste composition as Hazardous and Non-Hazardous type of waste. The waste disposal methods have been centred around energy recovery mechanism and no-energy recovery mechanisms. These are namely incineration (with energy recovery), incineration (without energy recovery), disposal to landfill and other disposal operations.
The details are mentioned below.
| Hazardous Waste Category (Tons) | FY 2022-23 |
|---|---|
| Incineration (with energy recovery) | 652 |
| Incineration (without energy recovery) | 93 |
| Landfilling | 1,372 |
| Other disposal operations | 119 |
| Total | 2,237 |
| Non-Hazardous Waste Category (Tons) | FY 2022-23 |
|---|---|
| Incineration (with energy recovery) | 0 |
| Incineration (without energy recovery) | 0 |
| Landfilling | 42 |
| Other disposal operations | 3,245 |
| Total | 3,287 |